Jump to main content Jump to navigation Jump to footer

The CO₂ Impact of Transport

Transport constitutes a significant portion of materials' total climate impact, especially for natural materials. In EPDs, this is reported as module A4 – transport to the construction site. In projects with high environmental requirements, this can be an important decision-making criterion when selecting materials.

Visual Tools for Assessing Transport Emissions

Minera Skifer, in collaboration with Asplan Viak, has developed two maps that visualize CO₂ emissions related to material transport. These can be used as support in documentation and decision-making processes.

Applications

The maps and accompanying data can be used in the following contexts:

  • Early-stage assessment of material choices
  • Life Cycle Assessments (LCA)
  • Documentation in environmental certifications (LEED, BREEAM)
  • Evaluation of supply chain and supplier selection

Maps as a basis for assessing transport emissions

The maps provide an estimate of CO₂ emissions from transport (A4) and can be used as a basis for assessment and documentation.

Examples of applications:

  • Assess the significance of transport in the early phase of the project
  • Compare emissions from different regions and suppliers
  • Estimate the A4 component in LCA/EPD
  • Document choices in environmental certification systems

Assumptions:

  • All emissions are calculated for 1 ton of material
  • Europe map: Truck transport from Oppdal and Offerdal
  • World map: Ship + 100 km truck transport (with certain exceptions)
  • Data source: Asplan Viak 2022

Transport Emissions from Oppdal/Offerdal to Europe

The map shows calculated emissions (kg CO₂e per ton) for transport by truck from the production site to selected European cities. The emission level is illustrated with color codes: green for low emissions and red for high.

  • Based on 1 ton transported by truck
  • Emission factor: 0.0685 kg CO₂e per ton-kilometer
  • The map can be used in both directions: from production site to market, or vice versa
  • Supplemented with a transport table for own calculations

Data source: Calculations performed by Asplan Viak through energy and environmental consultant Oddbjørn Dahlstrøm Andvik (2022).
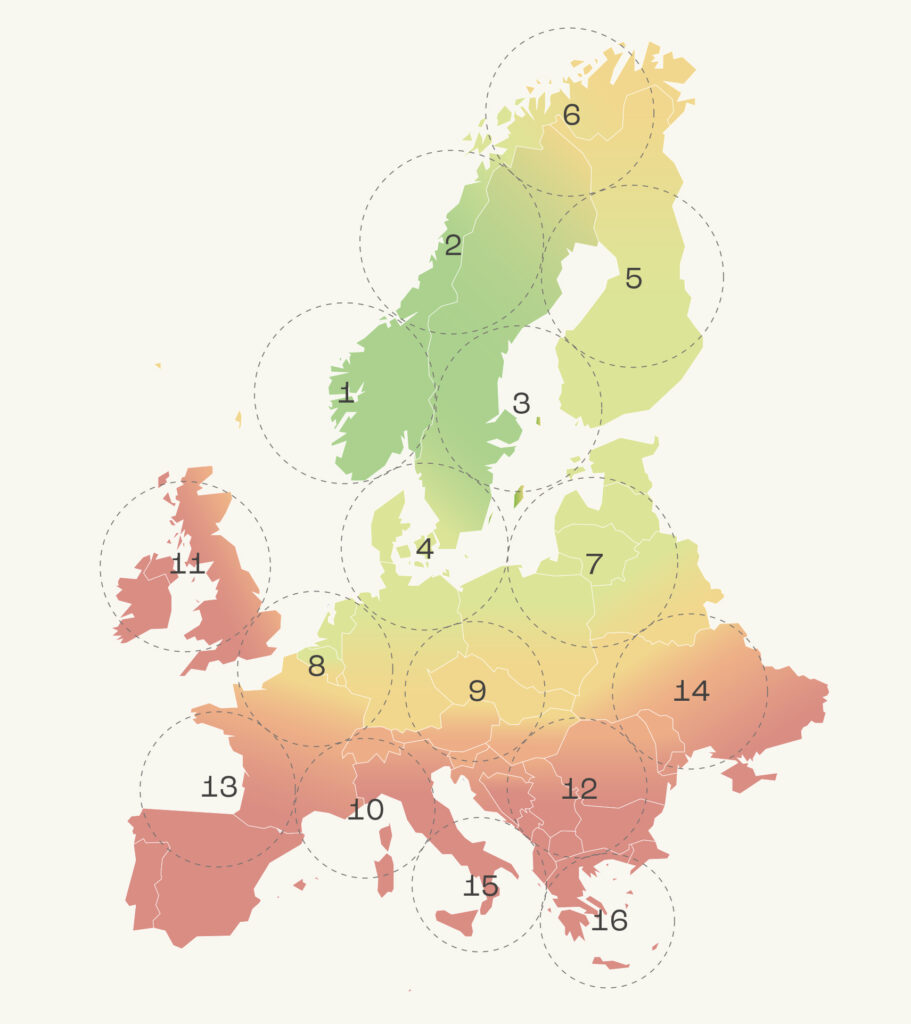
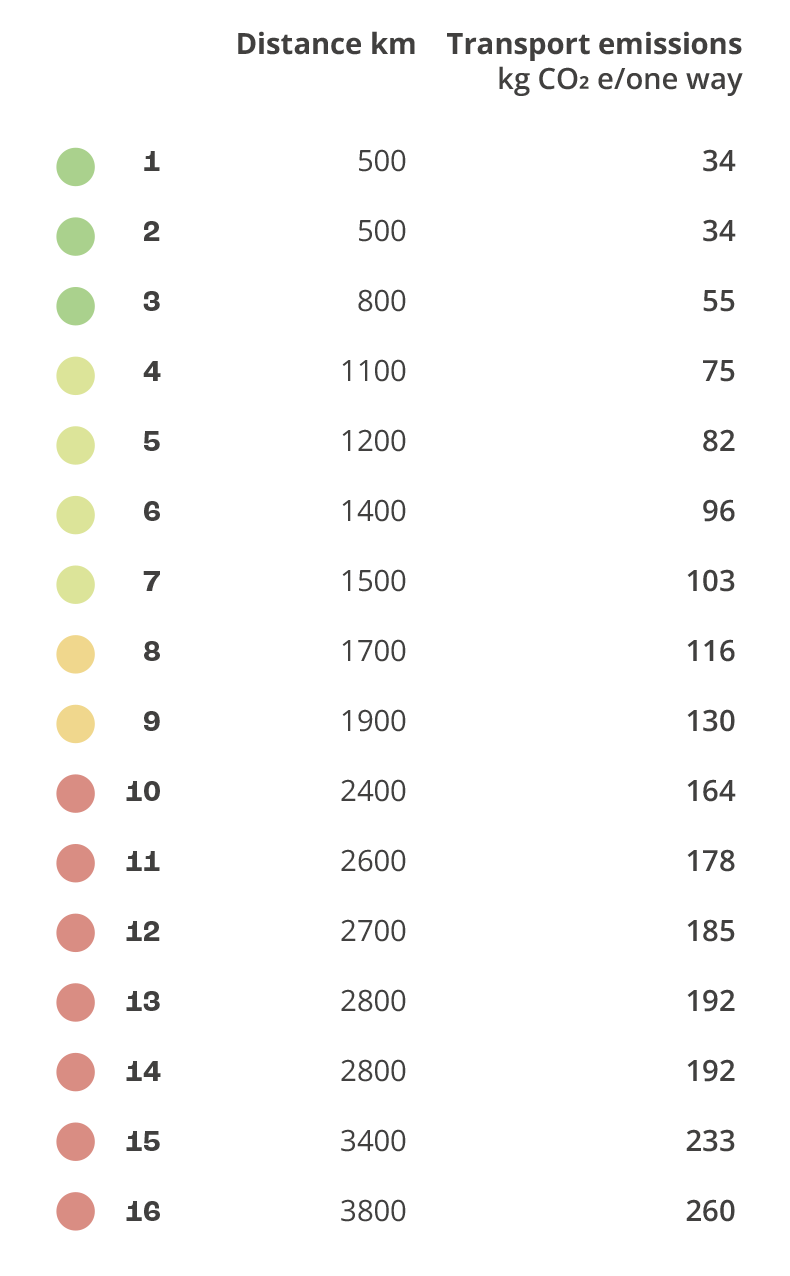
Transport Distances and Calculated Emissions (Truck Transport, 1 Ton). Emissions are calculated using a standard factor of 0.0685 kg CO₂e per ton-kilometer.

The map illustrates the climate impact of transport from the production site to various cities in Europe but can also be used in the opposite direction – to assess emissions when importing materials to, for example, Oslo.

The table provides a basis for own calculations and documentation in project-specific analyses..

Transport Emissions to Oslo from Various World Regions

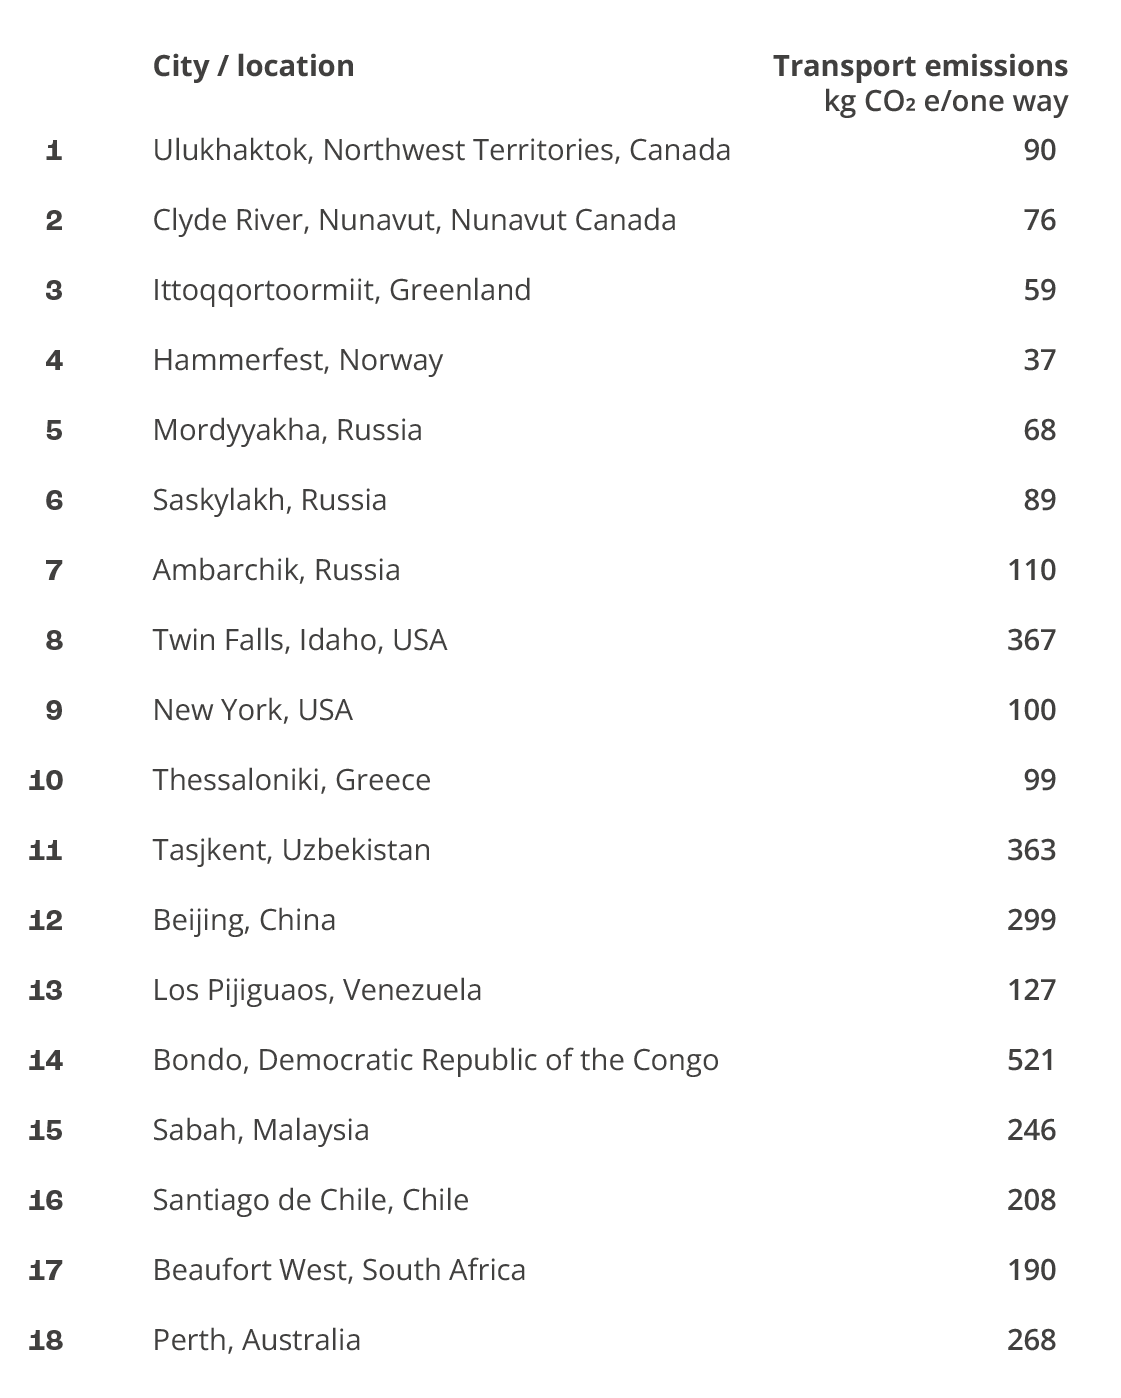
The map is divided into 18 geographical zones with representative cities. It shows transport-related emissions when importing to Oslo and provides an overview of the transport’s share in the overall climate footprint.

  • Based mainly on ship transport + 100 km truck
  • Exceptions (truck only): Twin Falls (USA via New York), Tashkent (Uzbekistan), Bondo (Kenya)
  • Same color coding as in the Europe map
  • Emissions per city/zone indicated in the table

Data source: Calculations performed by Asplan Viak (2022), through Oddbjørn Dahlstrøm Andvik.
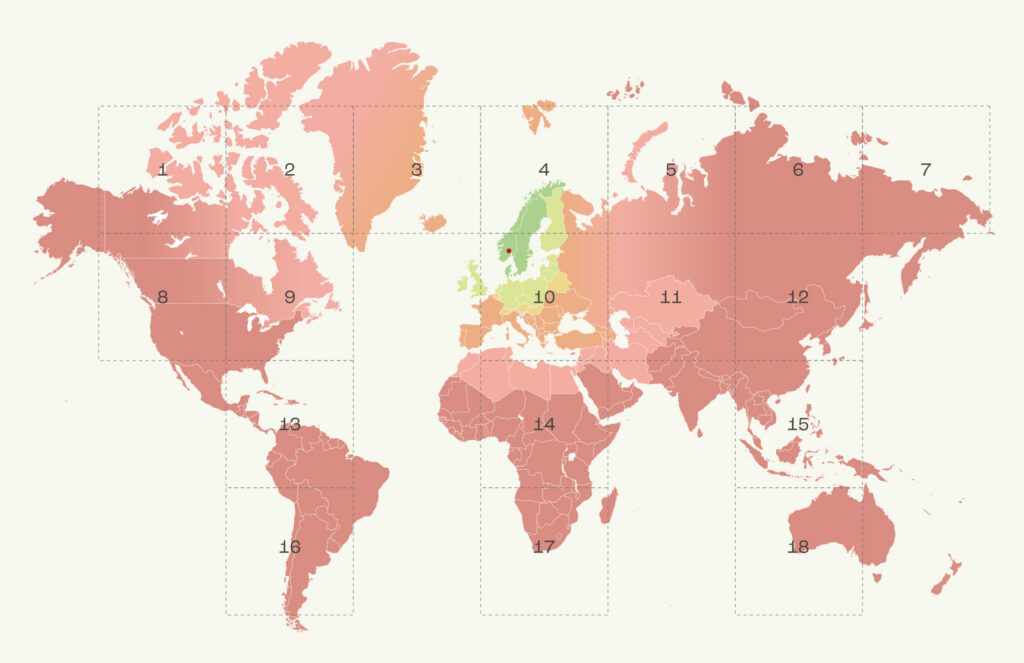
Emission Levels per Zone/City to Oslo (1 Ton). The color codes in the map are based on calculations of representative freight routes from factory to Oslo. The table provides detailed emission data per zone and can be used for comparison and documentation in material assessments and climate calculations.

Do You Have Questions About Transport Emissions?

Would you like to understand how transport affects the carbon footprint of slate in your project, or how to best utilize EPD data in assessing the climate impact of transport?

We assist you with calculations and data usage tailored to your project’s needs.

We are sorry, but you are using a version of Internet Explorer that is not supported on this site. The browser is no longer updated by Microsoft and may therefore pose a security risk. We recommend that you use a different browser. Welcome back!