The CO₂ Impact of Transport

Minera Skifer, in collaboration with Asplan Viak, has developed two maps that visualize CO₂ emissions related to material transport. These can be used as support in documentation and decision-making processes.
The maps and accompanying data can be used in the following contexts:
The maps provide an estimate of CO₂ emissions from transport (A4) and can be used as a basis for assessment and documentation.
Examples of applications:
Assumptions:
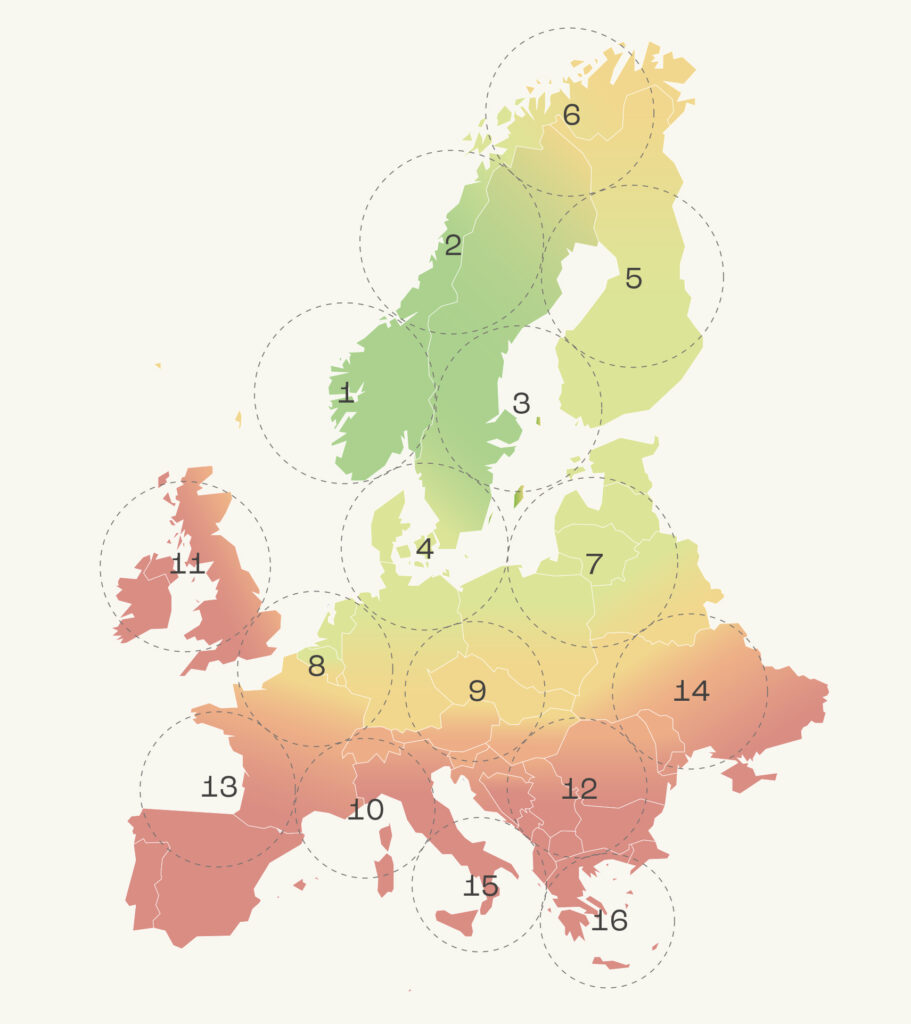
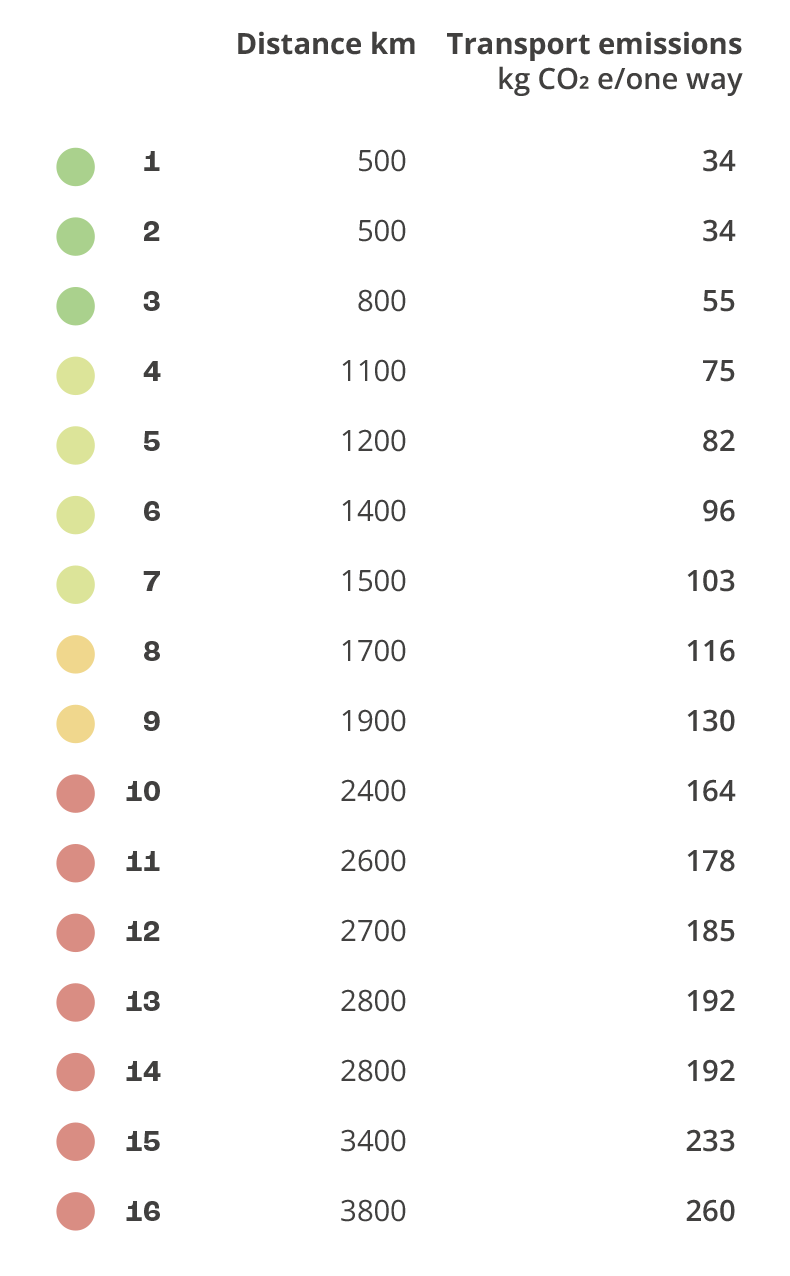
The map shows calculated emissions (kg CO₂e per ton) for transport by truck from the production site to selected European cities. The emission level is illustrated with color codes: green for low emissions and red for high.
Data source: Calculations performed by Asplan Viak through energy and environmental consultant Oddbjørn Dahlstrøm Andvik (2022).


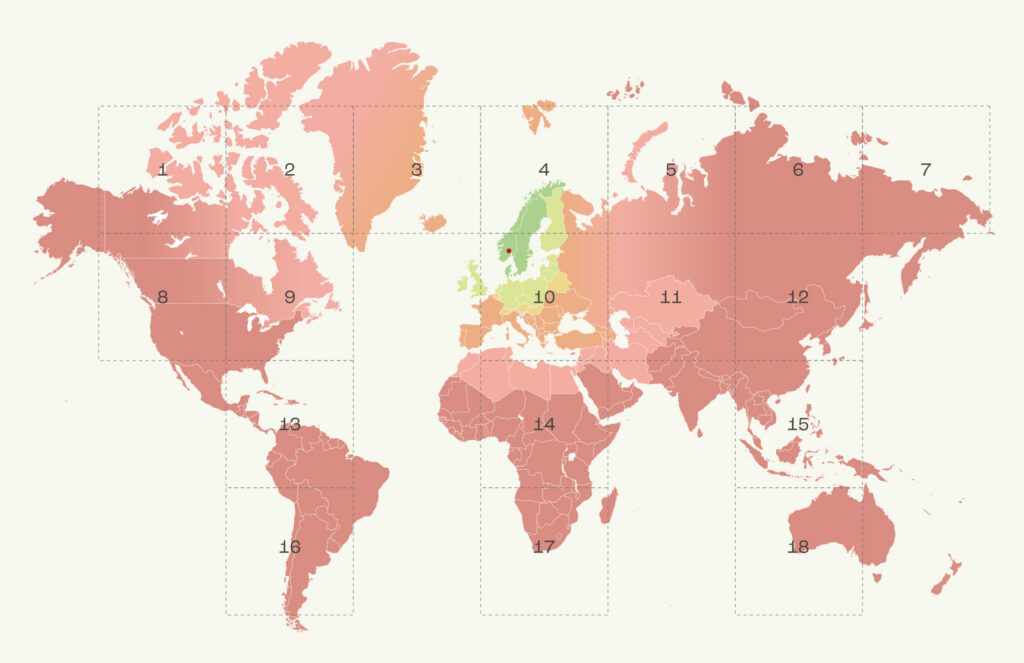
The map illustrates the climate impact of transport from the production site to various cities in Europe but can also be used in the opposite direction – to assess emissions when importing materials to, for example, Oslo.
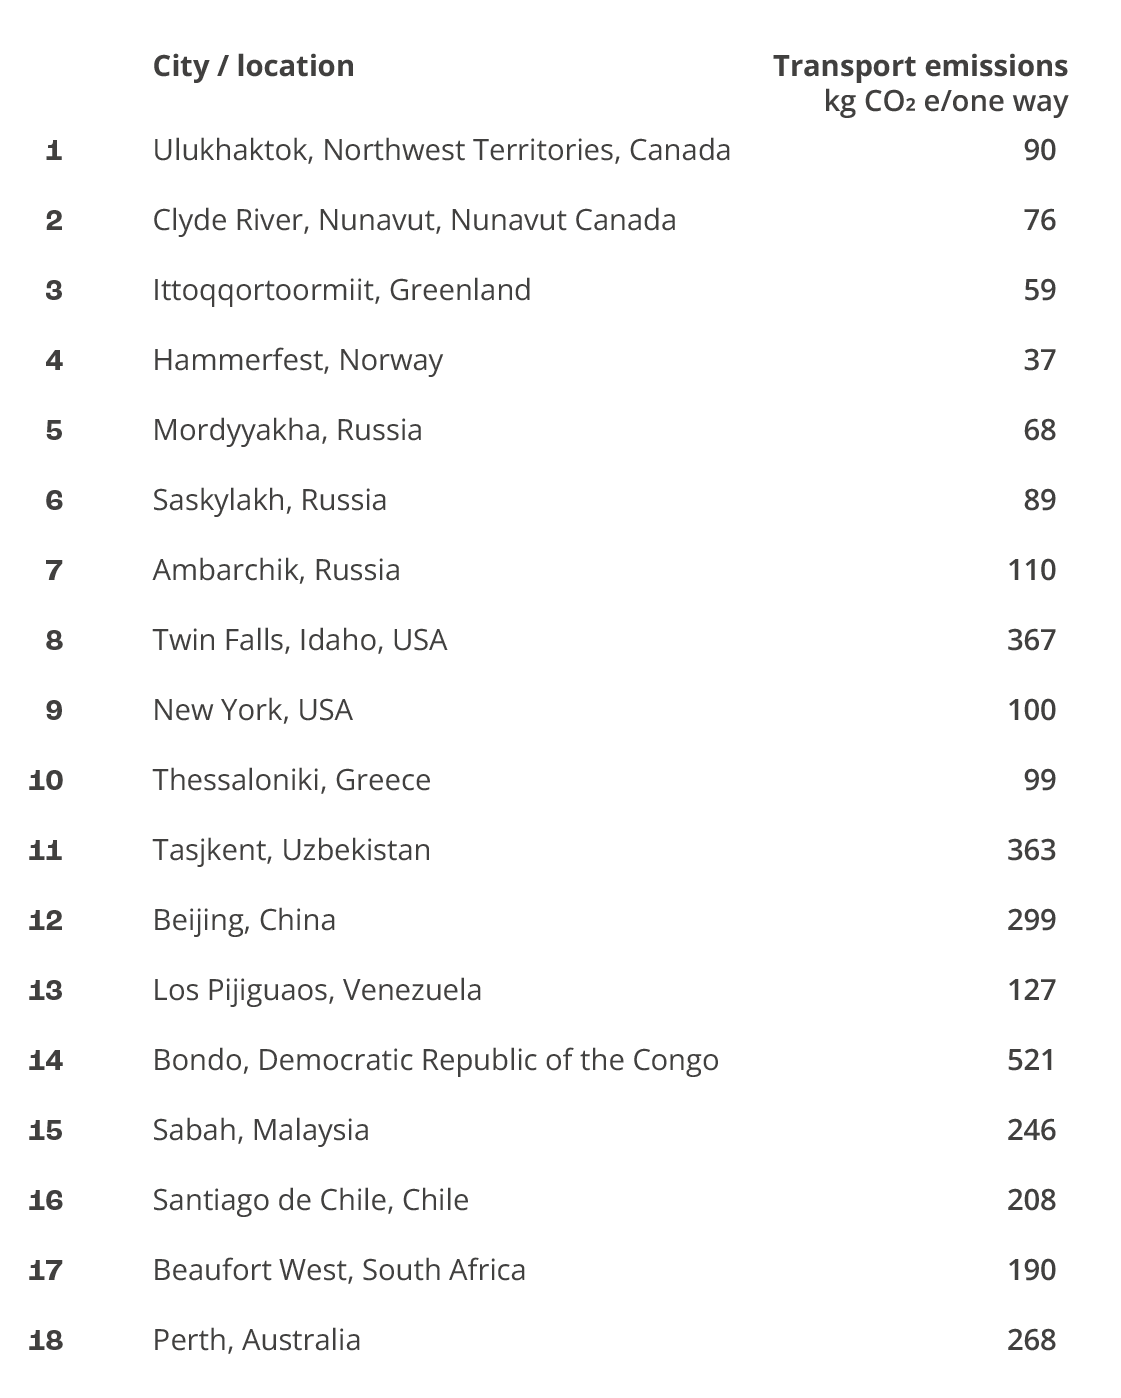
The table provides a basis for own calculations and documentation in project-specific analyses.
The map is divided into 18 geographical zones with representative cities. It shows transport-related emissions when importing to Oslo and provides an overview of the transport’s share in the overall climate footprint.
Data source: Calculations performed by Asplan Viak (2022), through Oddbjørn Dahlstrøm Andvik.


Would you like to understand how transport affects the carbon footprint of slate in your project, or how to best utilize EPD data in assessing the climate impact of transport?
We assist you with calculations and data usage tailored to your project’s needs.
Contact us for technical assistance.
