Jump to main content Jump to navigation Jump to footer

Guide: Interpreting and Comparing EPDs

An Environmental Product Declaration (EPD) is a standardized document that summarizes the environmental impact of a building material based on life cycle assessment (LCA). The EPD provides a basis for product comparison and documentation of material choices.

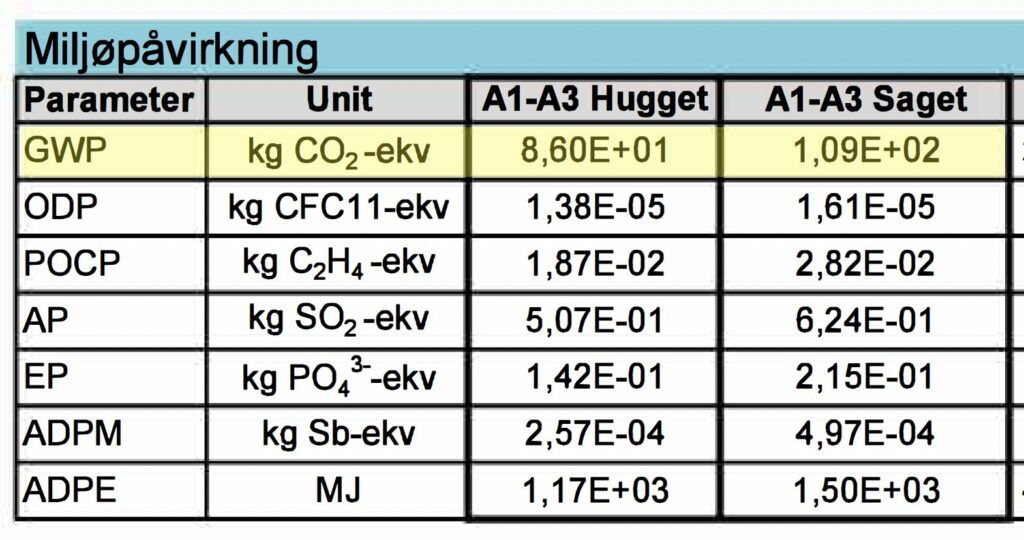
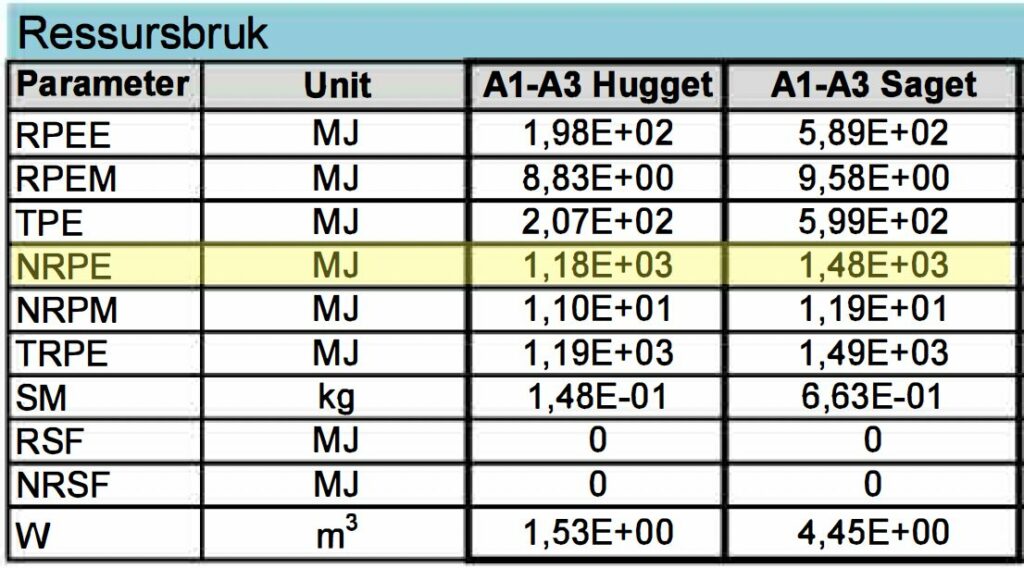
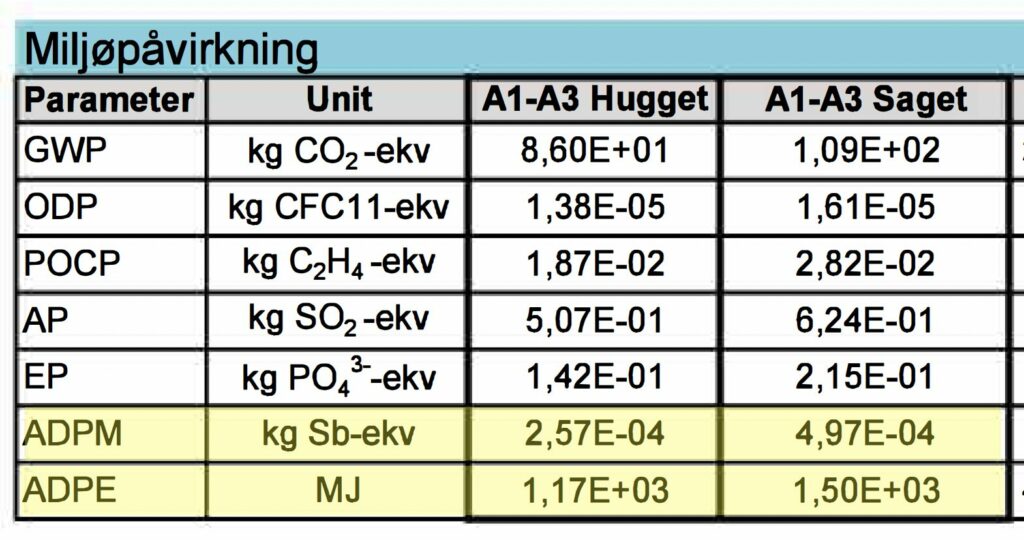
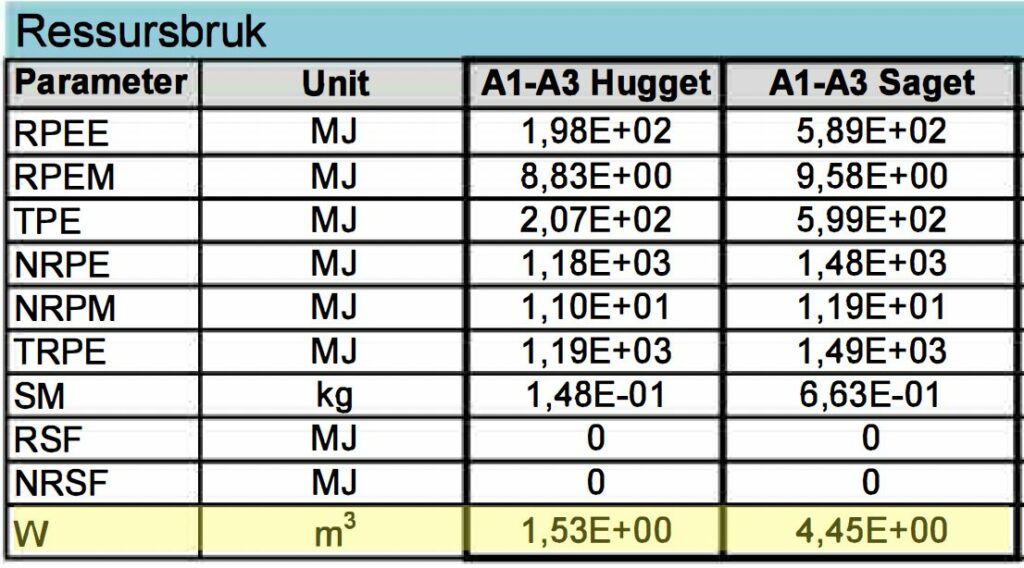
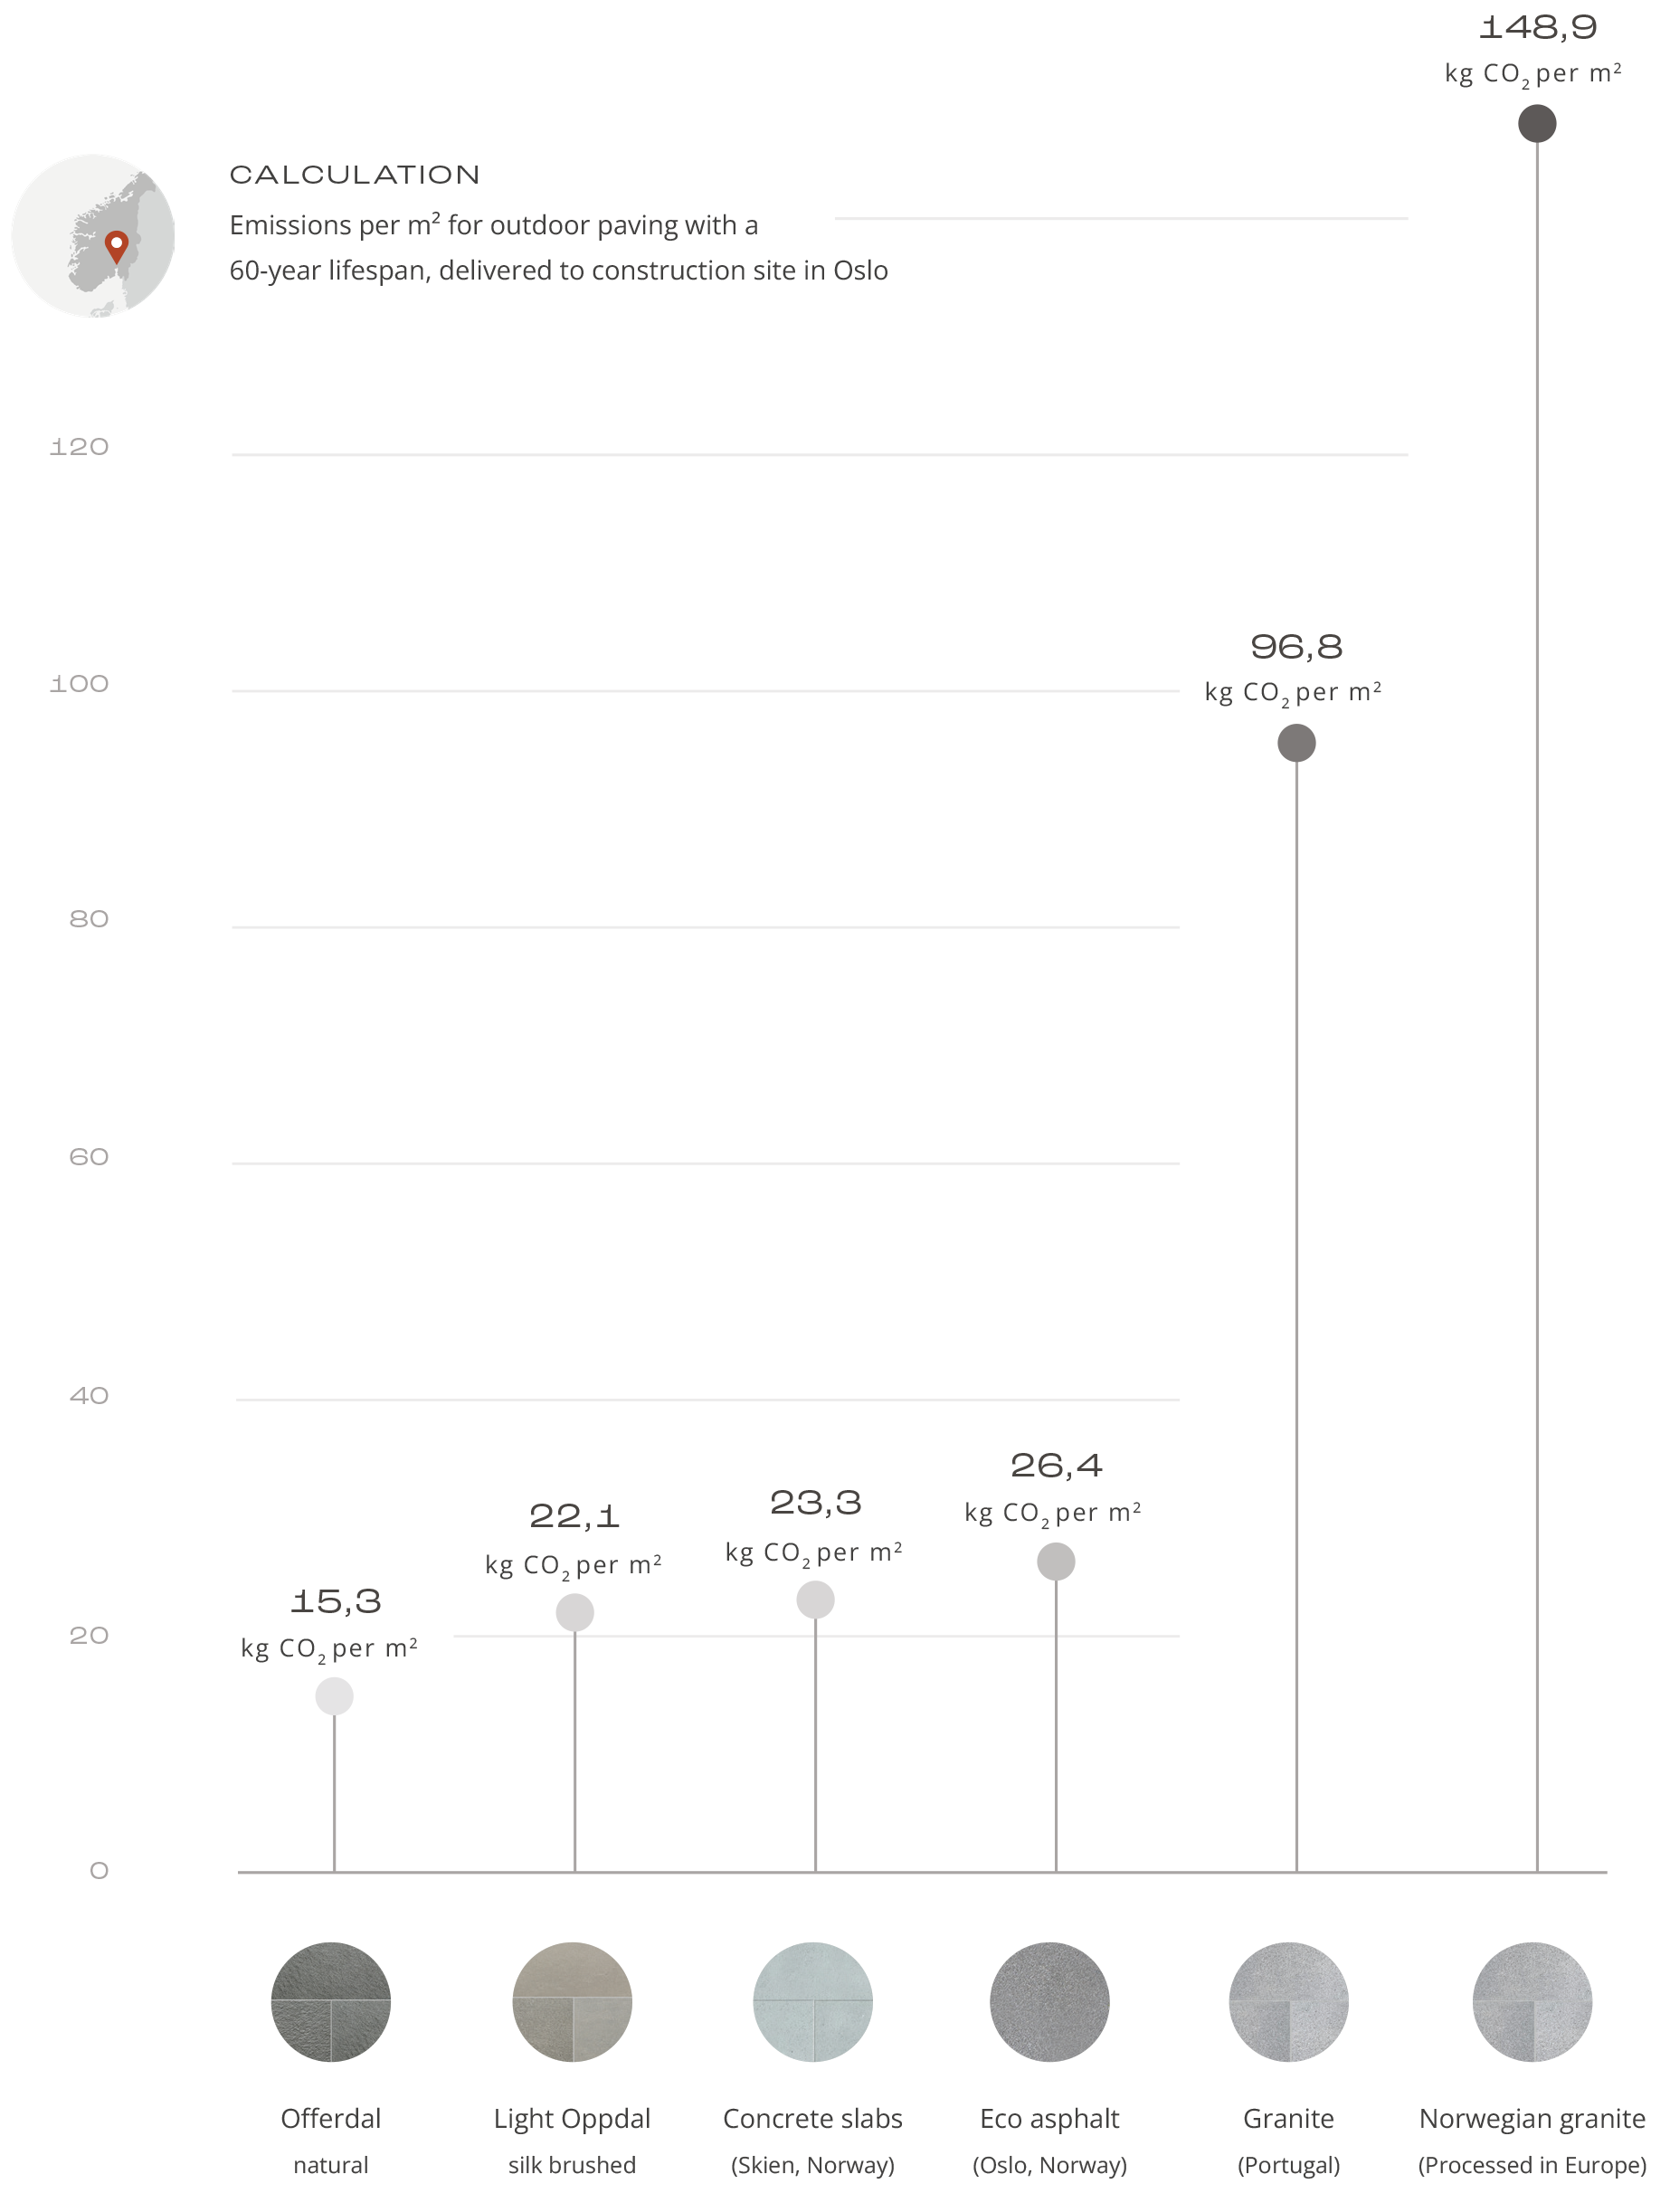
This guide outlines four key indicators in EPDs and how they can be interpreted and compared. The examples are drawn from the EPD for Oppdal slate natural cut, with either chiseled or sawn edge.

Glossary

Environmental Terms
  • CO₂-equivalents (CO₂-eq):
    A way to measure greenhouse gas emissions. It is converted to how much CO₂ would have the same climate effect. Think of it as a common “currency” for all types of greenhouse gases.
  • Global Warming Potential (GWP):
    Indicates how much a material contributes to global warming. Lower value = better for the climate.
  • Ozone Depletion Potential (ODP):
    Indicates how much a material affects the ozone layer, which protects us from harmful UV radiation.
  • Acidification Potential (AP):
    Measures how emissions contribute to acid rain, which can damage ecosystems. Low value = less environmental damage.
  • Eutrophication Potential (EP):
    Indicates how much nutrients (like nitrogen) the material contributes to nature. Too much can cause algae blooms in water.
  • Photochemical Ozone Creation Potential (POCP):
    Measures contribution to smog and air pollution. Low value means cleaner air.
Life Cycle Terms
  • Life Cycle Assessment (LCA):
    A comprehensive assessment of environmental impact from “cradle to grave” – from raw material extraction to waste management.
  • Cradle-to-grave:
    The entire life cycle of a product: production, transport, use, and what happens after use.
  • Cradle-to-gate:
    Only the production phase, until the product is ready for delivery.
  • Module A1-A3:
    Shows environmental impact from raw material (A1), transport to factory (A2), and production (A3).
  • Module A4-A5:
    Concerns transport to the construction site (A4) and installation (A5).
  • Module B (B1–B7):
    Use phase, including maintenance and energy consumption.
  • Module C (C1–C4):
    End-of-life phase, showing emissions from demolition, waste handling and recycling.
  • Module D:
    Bonus module! Shows environmental benefits from reuse and recycling after the project’s lifetime.

Energy Use and Resources
  • Abiotic Depletion Potential (ADP):
    Indicates to what extent a product contributes to depletion of non-renewable resources like metals and minerals.
  • ADP (kg Sb-eq):
    Unit for abiotic depletion potential, stated in antimony equivalents (Sb-eq). Antimony (Sb) is a metal used as a “reference” for comparing resource depletion. For example, “kg Sb-eq” means the resource depletion equals a certain amount of antimony. The higher the number, the more the material contributes to depletion of Earth’s limited resources.
  • ADPM (Abiotic Depletion Potential for Minerals and Metals):
    A more specific variant of ADP that focuses only on depletion of metals and minerals.
  • ADPE (MJ):
    Measures depletion of fossil resources in general, including both energy and raw materials used for non-energy purposes (e.g. oil used as chemical feedstock).
  • NRPE (MJ):
    Specifically measures non-renewable energy used as a power source in production.
  • Primary Energy (PENRE/PERE):
    Total energy use in production.
    • PENRE = Non-renewable energy (fossil fuels)
    • PERE = Renewable energy (like solar and hydro)
  • Energy consumption:
    Amount of electricity or fuel used in different stages of the material’s life cycle.
  • Material recycling:
    When the material can be reused instead of becoming waste – beneficial for the environment.
  • Waste categories:
    • Hazardous waste: Requires special handling.
    • Non-hazardous waste: Can be handled as regular waste.
    • Radioactive waste: Rare for building materials, but relevant in some cases.
Technical Terms
  • Functional unit:
    The basis for comparing materials. For example: “1 m² slate with a 60-year lifespan.”
  • Declared unit:
    A standardized measurement unit used in the EPD, such as 1 ton or 1 m².
  • Performance:
    How the material performs in practice – e.g. durability or wear resistance.
  • Flexural strength:
    How much stress a material can withstand before breaking when bent. Granite, for example, has lower flexural strength than slate.

The 4 Most Important Figures in an EPD


1. Global Warming Potential (GWP)

Definition

Shows greenhouse gas emissions in CO₂ equivalents (kg CO₂-eq). See explanation under “Environmental terms” in the glossary.

Meaning

Provides a direct indication of the material’s carbon footprint from the production phase, i.e. environmental impact from raw materials (A1), transport to the factory (A2), and production (A3). Lower values mean lower climate impact.


Compare with other materials to see which has the lowest carbon footprint from production by comparing the GWP values listed in each material’s EPD.

Values for Oppdal slate:

Hewn edge: 86.0 kg CO₂-eq per ton
Sawn edge: 109.0 kg CO₂-eq per tonn

By comparison, ceramic tiles, concrete pavers, and granite have 2–7 times higher emissions.

Placement in the EPD:

The values are written in exponential notation. The plus sign after “E” indicates how many places the decimal point should be moved to the right.

Chapter “LCA: Results” → table “Environmental impact” → row “GWP”, column “A1-A3”.

2. Energy Use (NRPE)

Definition

Non-renewable primary energy, reported in MJ (megajoules), used in production.

Shows how much non-renewable energy is used in production, expressed in MJ (megajoules). This includes energy from coal, oil, and gas used in extraction, transport, and processing of the material.

Meaning

High energy use increases climate impact, especially if the energy comes from fossil sources.

Values for Oppdal slate:

Hewn edge: 1,180 MJ per ton
Sawn edge: 1,480 MJ per ton

Ceramic tiles often require 4,000–8,000 MJ/ton and concrete pavers 1,500–3,000 MJ per ton. Oppdal slate has lower energy needs, partly due to a high degree of manual processing.

Placement in the EPD:

The values are written in exponential notation. The plus sign after “E” indicates how many places the decimal point should be moved to the right.

Chapter “LCA: Results” → table “Resource use” → row “NRPE”, column “A1-A3”.

3. Consumption of Non-Renewable Resources (ADPM and ADPE)

Definition

Describes the use of different types of non-renewable resources in production: ADPM shows use of mineral resources (kg Sb-eq)*. ADPE shows use of fossil resources (MJ) such as oil, coal, and gas.

* “kg Sb-eq”: See “Energy Use and Resources” in the glossary.

Meaning

Lower values mean reduced pressure on natural resources and greater future availability of essential raw materials.

Values for Oppdal slate:

Mineral resources:
Hewn edge: 0.000257 kg Sb-eq per ton
Sawn edge: 0.000497 kg Sb-eq per ton

Fossil resources:
Hewn edge: 1,170 MJ per ton
Sawn edge: 1,500 MJ per ton

These values are considered low for building materials. An ADPM value below 0.001 kg Sb-eq is generally considered low. Oppdal slate is largely produced with manual methods, which contributes to low resource impact.

Placement in the EPD:

The values are written in exponential notation. The plus sign after “E” indicates how many places the decimal point should be moved to the right.

Chapter “LCA: Results” → table “Environmental impact” → rows “ADPM” and “ADPE”.

4. Water Use (W)

Definition

Amount of freshwater used in production, measured in m³.

Meaning

Low water use reduces stress on water resources and the risk of pollution.

Values for Oppdal slate:

Hewn edge: 1.53 m³ per ton
Sawn edge: 4.45 m³ per ton

Oppdal slate has low to moderate water use compared to other building materials. Unadjusted slate has very low consumption, while thickness-calibrated slate is on par with ceramic tiles and other natural stone, typically 10–16 m³ per ton.

Placement in the EPD:

The values are written in exponential notation. The plus sign after “E” indicates how many places the decimal point should be moved to the right.

Chapter “LCA: Results” → table “Resource use” → row “W”.

Summary

An EPD provides a standardized basis for comparing the environmental impact of building materials. The most central indicators are:

  • GWP (Global Warming Potential): shows CO₂ emissions in the production phase
  • NRPE (Non-renewable energy use): shows how much fossil energy is used
  • ADPM/ADPE (Resource use): shows extraction of non-renewable minerals and fossil materials
  • W (Water use): shows resource pressure on water systems

These indicators offer a comprehensive picture of the material’s climate and resource impact.
For comparing material types, it is essential to evaluate the figures as a whole and in the context of service life, use, and transport.

Practical Advice

Assess the whole picture: Consider both production emissions and service life

Request EPDs: Compare values across products and suppliers

Use verified sources: EPDs from www.epd-norge.no are third-party verified

We are sorry, but you are using a version of Internet Explorer that is not supported on this site. The browser is no longer updated by Microsoft and may therefore pose a security risk. We recommend that you use a different browser. Welcome back!